
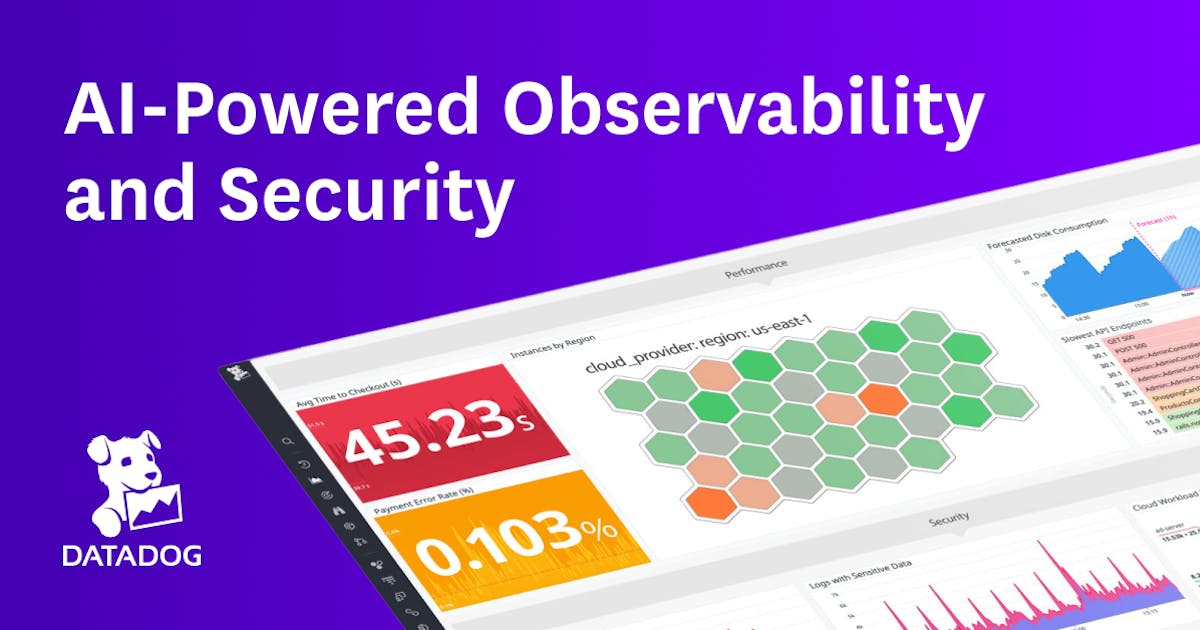
The Datadog web application serves as the primary interface for unified observability across cloud-native and hybrid environments. It enables engineers to correlate metrics, traces, and logs in real-time, facilitating rapid incident detection, root cause analysis, and performance optimization directly within a browser-first workflow. This platform consolidates telemetry from diverse infrastructure and application components, providing a centralized control plane for operational health and adherence to SLOs.
D
Datadog Website Full Guide (2026)
Cloud monitoring and analytics platform.
WebsiteTechPaid
5.0 (AI Aggregated)
Updated May 26, 2026
Introduction
Key Features
Core Capabilities
Customizable Dashboard Canva
Log Explorer Interface
Trace View Waterfall
Metric Explorer Query Builder
Additional Details
Synthetic Test Configuration Panel
Alert Rule Editor
Service Map Visualization
Incident Management Console
Use Cases
For Developers
Debugging Application Performance Issue
A developer uses the web interface to drill down from high-level service metrics into specific request traces and associated logs to pinpoint the exact line of code or database query causing latency spikes in a production microservice
How to Use Datadog
Log In and View Overview Dashboard
Navigate to the login page, authenticate credentials, and land on the main overview dashboard, which provides a high-level summary of system health and active alert
Datadog Alternatives


Dynatrace
Software intelligence for cloud complexity.

Prometheus
Open-source systems monitoring & alerting.

Checkmk
Comprehensive IT monitoring solution.

Grafana
Open observability platform (visualization).
About Datadog
Useful Links
1 totalVideo Mentions
Datadog Status
Active
Service is operational