URLs.ai
Dynatrace icon
WebsiteSEOFreemium

What Is Dynatrace Used For: Features, Reviews & Alternatives

Software intelligence for cloud complexity.

Editorially updated Oct 25, 2025

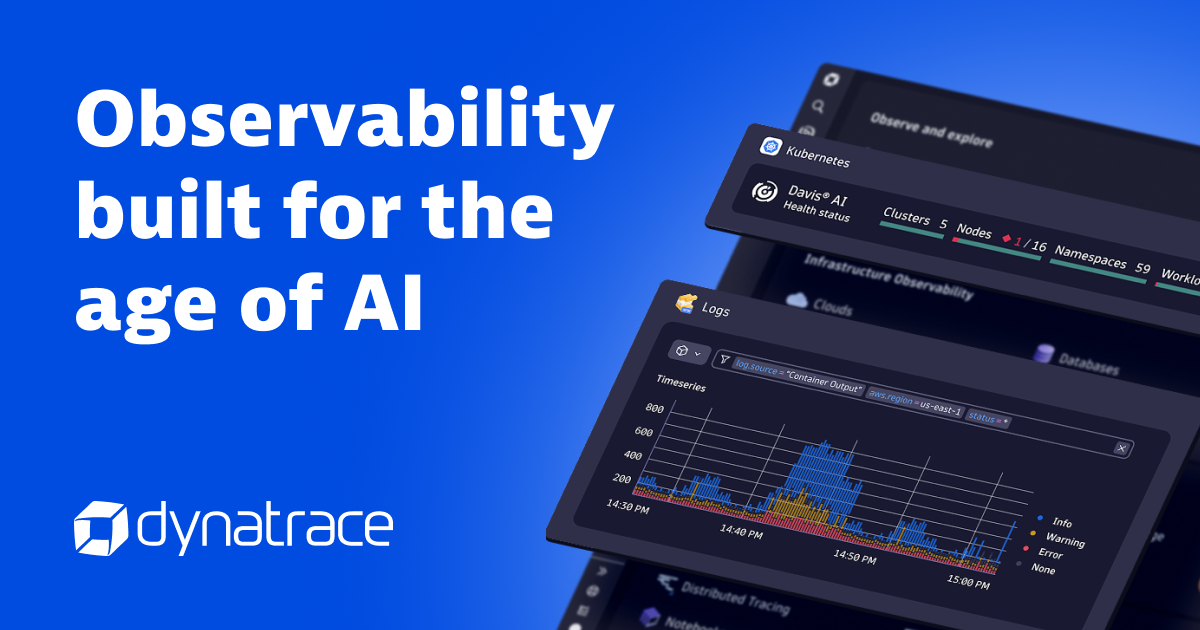
Screenshot of Dynatrace

The overview

What Dynatrace is for

Dynatrace delivers a unified software intelligence platform, primarily accessed through its web console, to provide deep observability and AI-driven insights across complex cloud-native and hybrid environments. It enables development and operations teams to proactively monitor application performance, infrastructure health, and user experience, facilitating rapid problem identification and resolution directly from a browser-first workflow. The platform's core job is to transform raw monitoring data into actionable intelligence, reducing MTTR and optimizing digital services.
Key features

1Core Capabilitie

  • Distributed tracing and code-level visibility
  • Real User Monitoring (RUM) dashboard
  • Synthetic transaction monitoring setup
  • Log ingestion and analysis console
  • Infrastructure monitoring metrics view

2Specialized Workflow

  • AI-powered root cause analysis (Davis AI)
  • Automatic dependency mapping (Smartscape)
  • Cloud cost optimization insights panel
  • Application security vulnerability detection
  • Service-level objective (SLO) configuration

Who it helps

Useful ways to use Dynatrace

01
Debugging Microservices Performance
Developers leverage to pinpoint code-level bottlenecks and transaction failures within distributed microservices architectures. They can trace requests across multiple services, analyze method-level execution times, and correlate performance issues with specific code deployments or infrastructure changes, all from a unified browser interface
02
Proactive Incident Response and SRE
Operations and SRE teams utilize for automated problem detection and root cause analysis. The platform's AI engine correlates disparate alerts into single, actionable problems, providing immediate context and impact analysis, enabling faster incident resolution and improved system reliability without manual data correlation
03
Scaling Cloud Infrastructure Efficiently
Startups can monitor their rapidly evolving cloud infrastructure and applications to ensure performance and control costs during growth phases. provides automatic discovery of new services, real-time resource utilization insights, and performance baselining, allowing lean teams to maintain stability and optimize cloud spend without extensive manual configuration

A practical path

How to use Dynatrace

Onboard a New Service for Monitoring

Navigate to the 'Deploy ' section in the web console. Select your target environment (e.g., Kubernetes, AWS EC2, Azure VM) and follow the guided instructions to install the OneAgent. The agent automatically discovers and begins monitoring your application components and infrastructure

External signals

Reviews & reputation

AI aggregated
4.6/ 5

Aggregated review score

Highly regarded for its comprehensive full-stack observability, AI-driven root cause analysis, and ease of deployment in complex cloud environments. Users frequently praise its automatic instrumentation and ability to reduce MTTR, though some note the pricing model can be complex for smaller organizations.

Quick answers

Frequently asked questions

1What is the typical performance overhead of the Dynatrace OneAgent on monitored hosts?

The Dynatrace OneAgent is engineered for minimal overhead, typically consuming less than 1-2% CPU and 50-150 MB RAM on most production systems. Its adaptive instrumentation ensures that resource consumption scales efficiently, even in highly dynamic cloud-native environments, without impacting application performance.

2How does Dynatrace handle data privacy and compliance for sensitive application data?

Dynatrace offers robust data privacy features, including configurable data masking and redaction rules for sensitive information in logs, traces, and user sessions. It supports various compliance standards (e.g., GDPR, HIPAA, SOC 2) and provides granular access controls, ensuring that only authorized personnel can view specific data segments.

3Can Dynatrace effectively monitor serverless functions and containerized applications?

Yes, Dynatrace provides deep, automatic observability for serverless functions (e.g., AWS Lambda, Azure Functions) and containerized applications (e.g., Docker, Kubernetes). The OneAgent automatically instruments these dynamic environments, providing full-stack visibility from code execution within a function to container resource utilization and underlying infrastructure.

4What is the learning curve for new SREs or developers adopting Dynatrace?

Dynatrace is designed for rapid adoption. Its automatic instrumentation and AI-driven insights significantly reduce the manual configuration and data correlation typically required. While understanding advanced features takes time, core monitoring and problem identification can be achieved quickly, supported by extensive documentation and in-product guidance.

5How does Dynatrace's licensing model scale with dynamic cloud environments and ephemeral resources?

Dynatrace's licensing is consumption-based, primarily measured by host units (for infrastructure monitoring) and Digital Experience Monitoring (DEM) units (for RUM/Synthetic). This model is well-suited for dynamic cloud environments, as it scales with your actual usage, accommodating ephemeral resources and auto-scaling groups without requiring constant license adjustments.

Keep exploring

More products

Browse all websites