
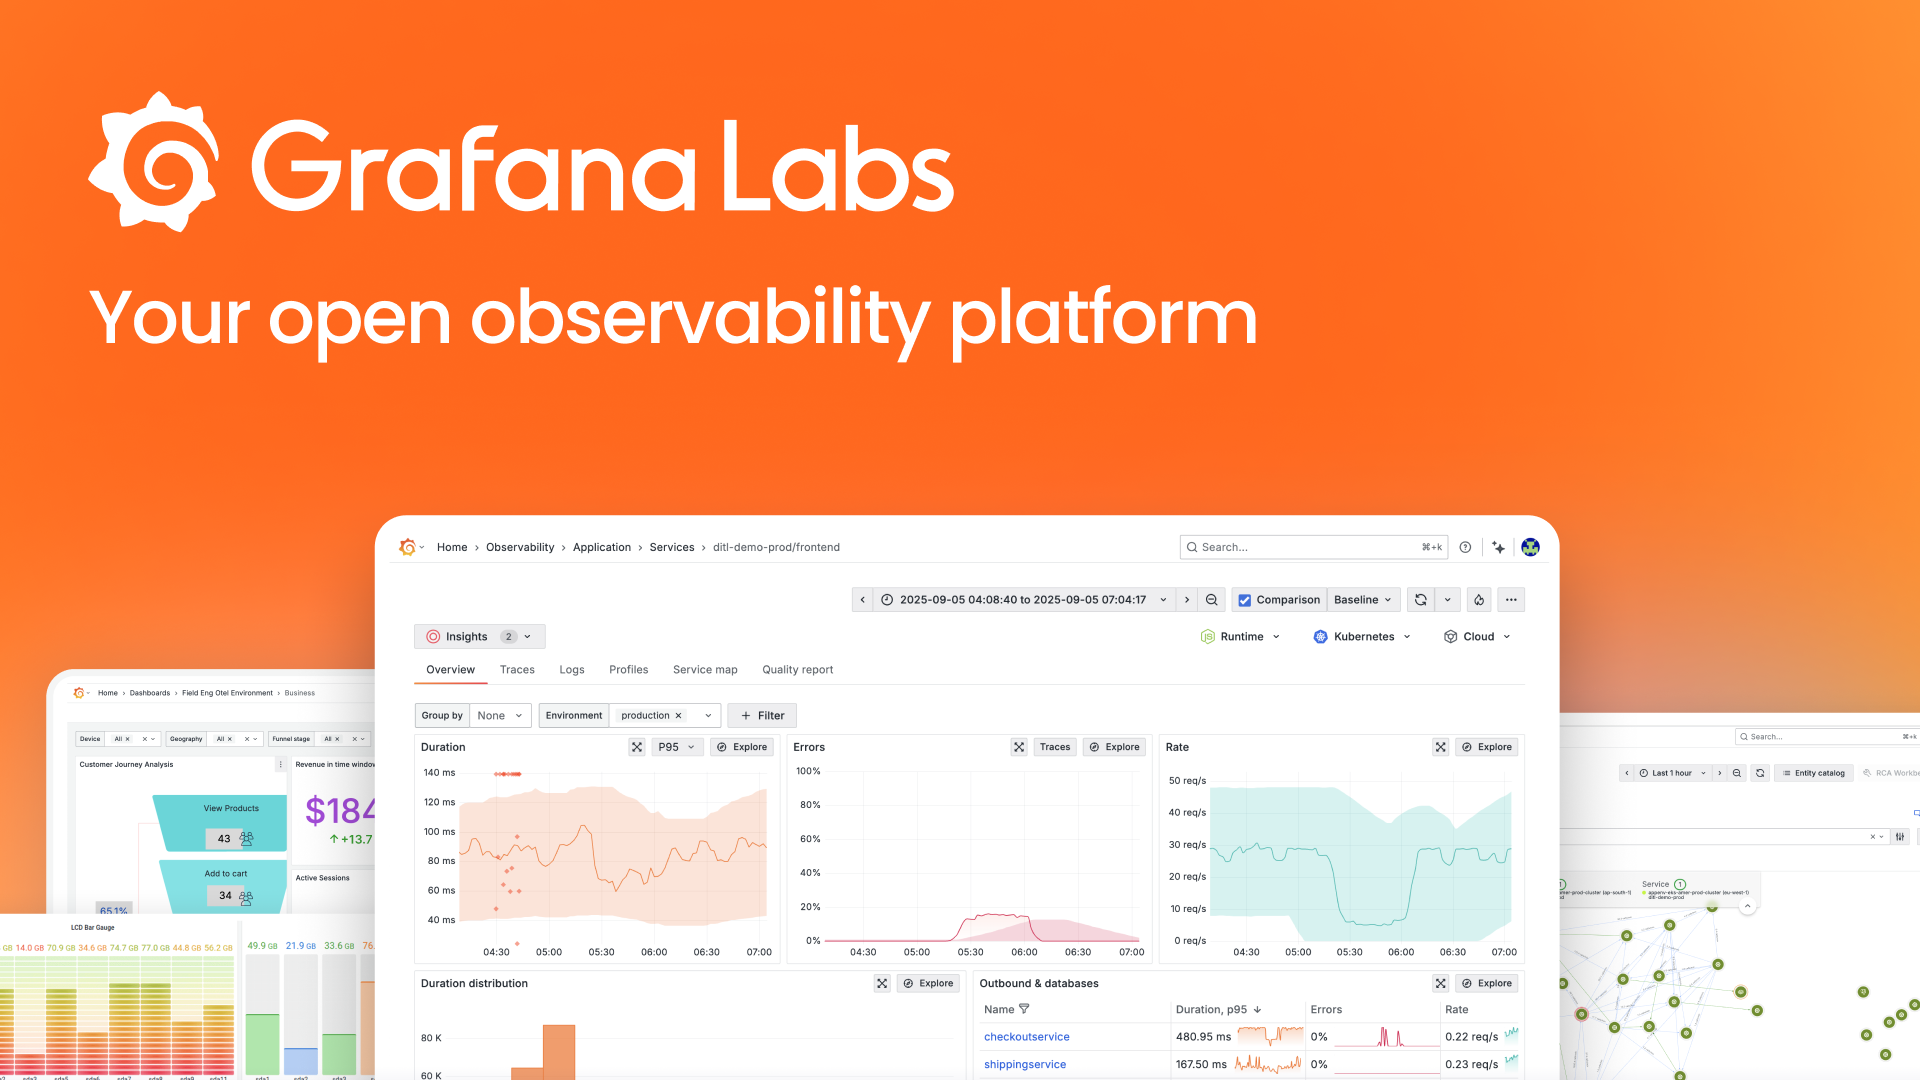
Grafana provides a browser-first interface for visualizing time-series metrics, logs, and traces from diverse data sources. Its primary web workflow enables engineers to connect to their observability backends, construct interactive dashboards, and define alerting rules directly within the browser, facilitating real-time system health monitoring and post-incident analysis.
G
Grafana Website Full Guide (2026)
Open observability platform (visualization).
WebsiteTechMonitoring
3.6 (AI Aggregated)
Updated May 26, 2026
Introduction
Key Features
Core Capabilities
Data Source Connection Panel
Dashboard Editor Canva
Query Explorer Interface
Alert Rule Management UI
Additional Details
Panel Library
Templating Variable Configuration
Annotation Overlay Editor
Playlist Management
Use Cases
For Developers
Application Performance Debugging
Developers use to correlate application metrics (e.g., request latency, error rates from Prometheus) with structured logs (from Loki) and distributed traces (from Tempo) to quickly pinpoint performance bottlenecks or identify root causes of service failures in production environment
How to Use Grafana
Connect a Data Source
Navigate to the "Connections" section in the left-hand menu, select "Add new data source," choose your backend (e.g., Prometheus, Loki), and input the required connection details (URL, authentication). Test the connection to ensure accessibility
Grafana Alternatives


New Relic
Observability platform for applications/infra.

Prometheus
Open-source systems monitoring & alerting.

Netdata
Real-time performance monitoring (self-hostable).

Nagios
Industry standard in IT infra monitoring.
About Grafana
Platforms
Categories
Domaingrafana.com
Useful Links
1 totalVideo Mentions
Grafana 13 TL;DR — What’s New (and Worth Your Time)
Grafana Cloud Demo in Under 5 minutes | Full Stack Observability and more
Grafana Assistant Creates a Dashboard "Out of Thin Air" | AI-Powered Observability | Grafana Labs
Grafana 12 TL;DR: Observability as Code, Dynamic Dashboards & More Explained in 7 Min | Grafana Labs
Grafana Status
Active
Service is operational