
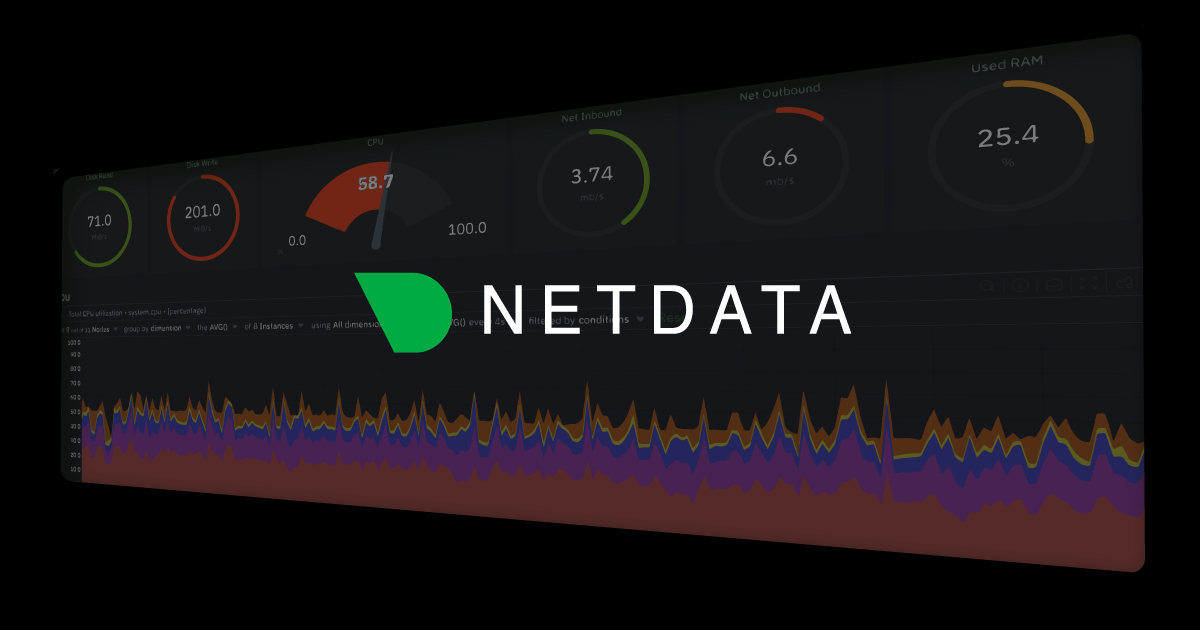
Netdata provides a browser-accessible interface for real-time, high-granularity performance monitoring across server infrastructure, containers, and applications. It aggregates metrics from deployed agents, offering immediate visibility into system health and resource utilization directly within a web browser, facilitating rapid incident detection and performance bottleneck identification.
N
Netdata Website Full Guide (2026)
Real-time performance monitoring (self-hostable).
WebsiteTechMonitoring
2.8 (AI Aggregated)
Updated May 26, 2026
Introduction
Key Features
Core Capabilities
Real-time Metric Collection
Interactive Dashboard UI
Pre-configured Data Collector
Anomaly Detection Engine
Additional Details
Distributed Monitoring Aggregation
Custom Alerting Configuration
Historical Data Retention
Metric Export API
Use Cases
For Developers
Debugging Application Performance Regression
Developers use the browser dashboard to pinpoint resource contention (CPU, memory, I/O) or network latency impacting their applications, correlating code deployments with performance changes in real-time
How to Use Netdata
Onboard a New Monitoring Agent
Navigate to the Cloud dashboard, click 'Add Node,' and follow the provided one-liner script to install and connect a agent from your server or container environment
Netdata Alternatives


Prometheus
Open-source systems monitoring & alerting.

Grafana
Open observability platform (visualization).

New Relic
Observability platform for applications/infra.

Nagios
Industry standard in IT infra monitoring.
About Netdata
Platforms
Categories
Domainnetdata.cloud
Useful Links
1 totalNetdata Status
Active
Service is operational